
Random Strange Product Grid Generator
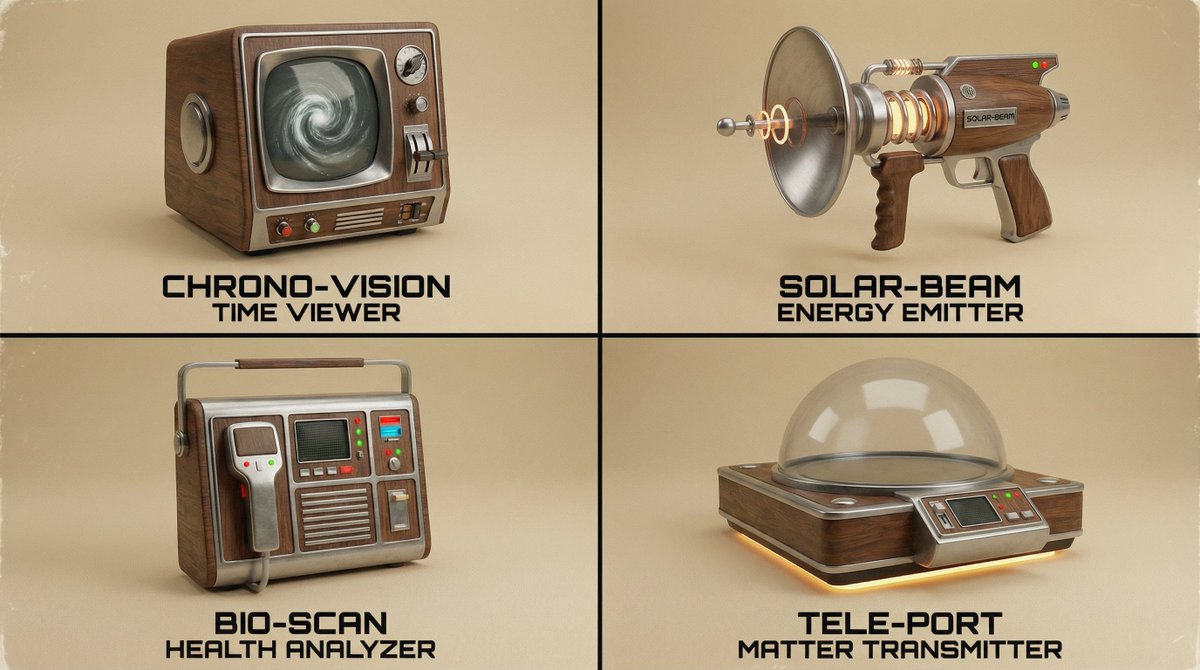
2 x 2 of random strange {argument name="year" default="Year"} {argument name="style" default="style"} products with what they are underneath in text
提示词库
汇集全球创作者的精选图像、视频与建站提示词。复制任意一条,替换主体或风格,即可用最新模型生成。
15,630 条提示词 · 每日更新 · 完全免费
共 599 条
2 x 2 of random strange {argument name="year" default="Year"} {argument name="style" default="style"} products with what they are underneath in text
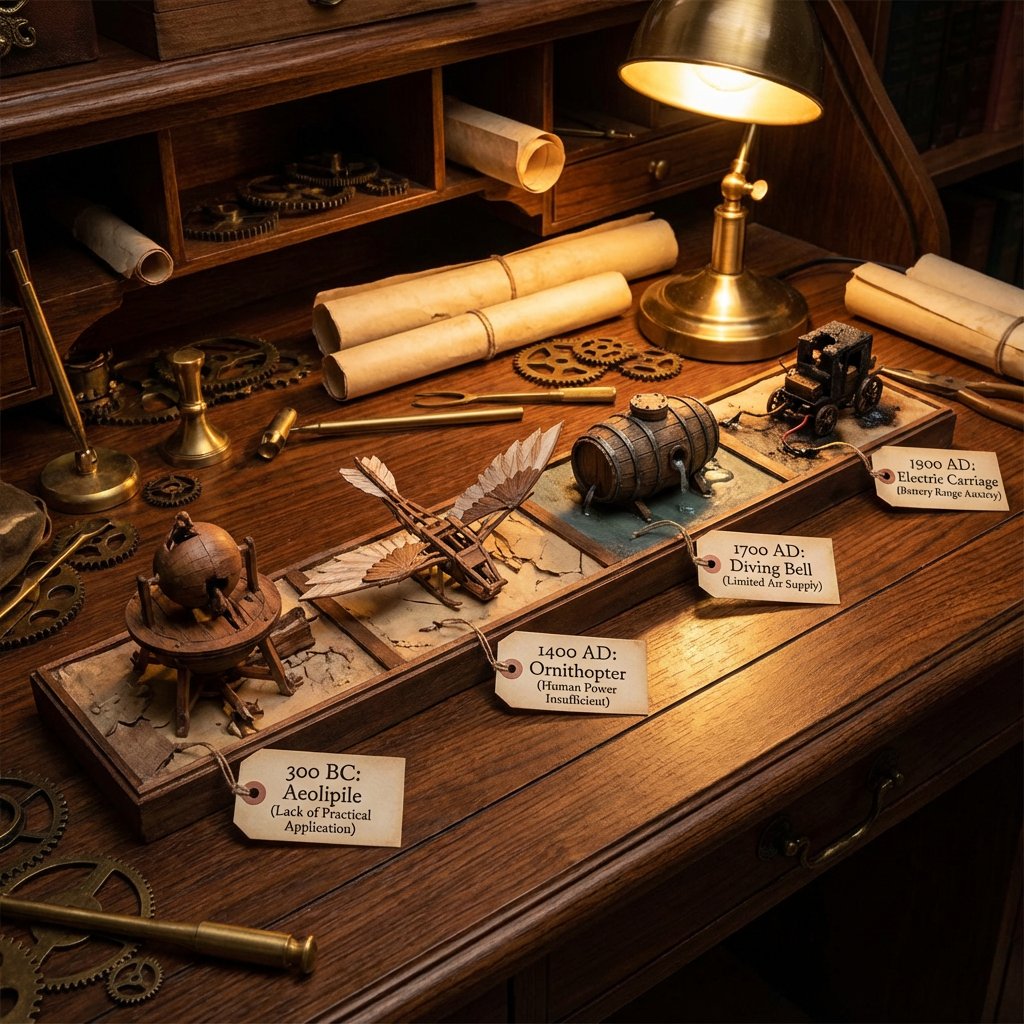
A detailed diorama on a long wooden desk showing a timeline of failed inventions from 4 different areas: {argument name="first invention date" default="300 BC"}: failed invention with a tag explaining in a couple of words why {argument name="second invention date" default="1400 AD"}: failed invention with a tag explaining in a couple of words why {argument name="third invention date" default="1700 AD"}: failed invention with a tag explaining in a couple of words why {argument name="fourth invention date" default="1900 AD"}: failed invention with a tag explaining in a couple of words why steampunk aesthetic, cluttered with scrolls, blueprints, gears, warm, workshop, lighting.
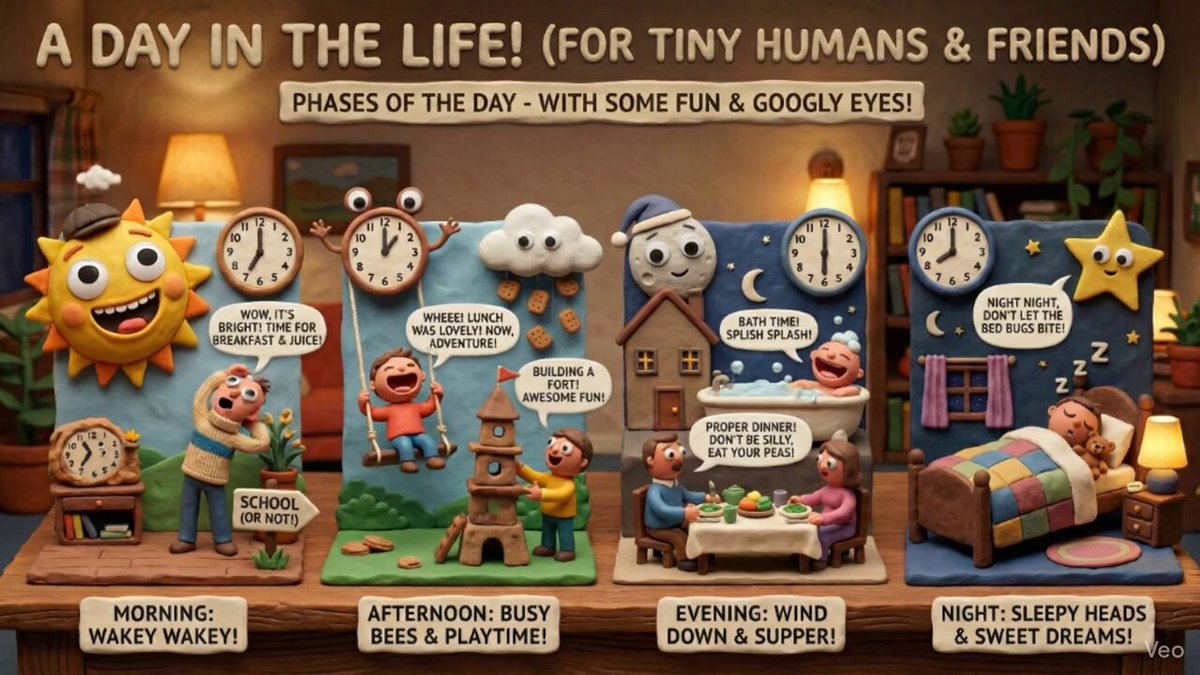
Create an infographic that explains the phases of the day, perfect for a {argument name="child_age" default="6-year-old"}, in the style of distinctive claymation with wide expressive mouths, googly eyes, and charming humor. Matte clay textures, handcrafted props, and warm, practical set lighting define the look.
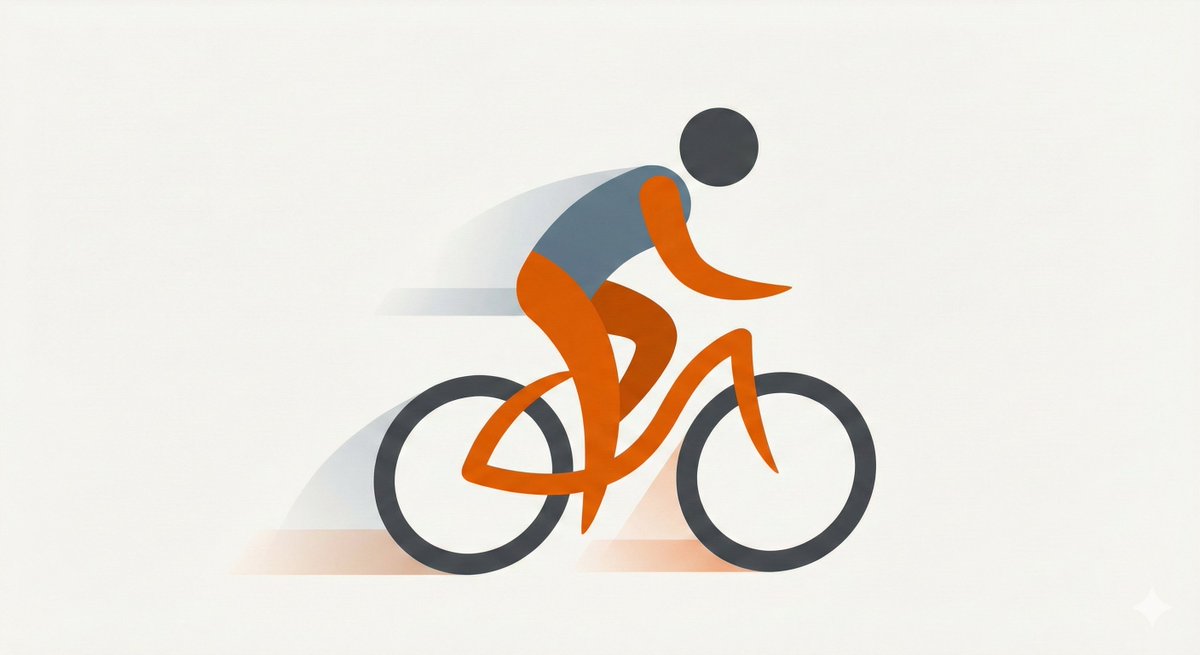
Minimal flat illustration of {argument name="subject" default="[SUBJECT]"}, simple geometric shapes, limited color palette, clean vector style, generous negative space, modern editorial illustration, soft shadows, smooth curves, high aesthetic minimalism.
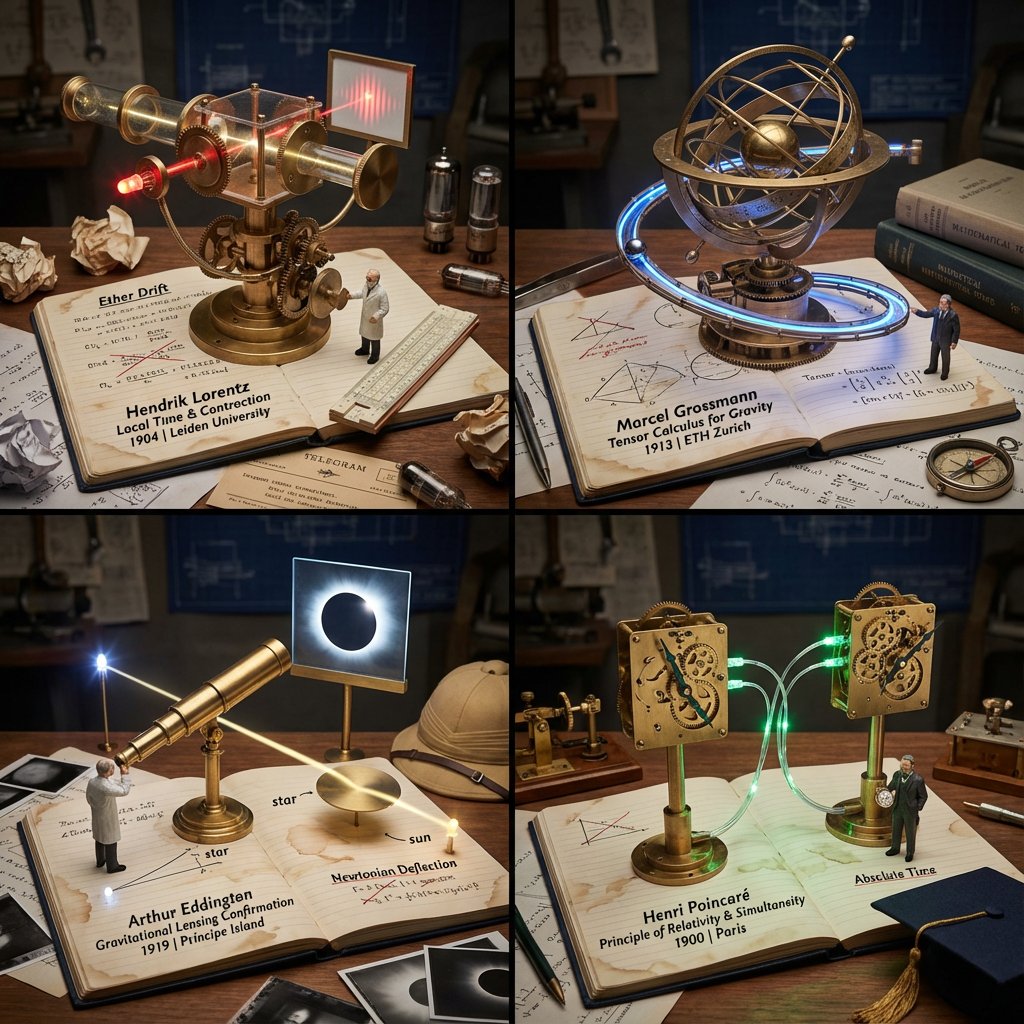
<instructions> Role: Science Historian & Kinetic Sculpture Engineer Input: [{argument name="scientific discovery" default="Scientific Discovery, e.g., DNA Structure, Theory of Relativity"}] Phase 1: Analysis 1. Identify the "eureka moment" and the failed attempts before it 2. Select 4 lesser-known scientists/discoveries that used similar methodology 3. Extract the physical apparatus used in the discovery (microscope, prism, blackboard equation) Phase 2: Execution Goal: 2x2 Grid of "Working Lab Notebook Contraptions" Rules per Panel: - The Base: An open, coffee-stained lab notebook with handwritten equations/sketches - The Machine: A functional brass and glass apparatus rises FROM the notebook pages (steampunk aesthetic) - The Process: The machine actively demonstrates the discovery (gears turning, liquid flowing, light refracting) - The Scientist: Tiny figurine in period lab coat taking notes with a fountain pen - The Failure: Crossed-out attempts and crumpled paper nearby - The Eureka: A single glowing element (LED) representing the breakthrough moment - The Label: Fountain pen handwriting: "Scientist Name | Discovery | Year | Lab Location" - The Props: Era-accurate items (telegram, slide rule, Bunsen burner, petri dishes) Output: 2x2 Grid, Industrial Scientific Photography, dramatic side lighting </instructions>
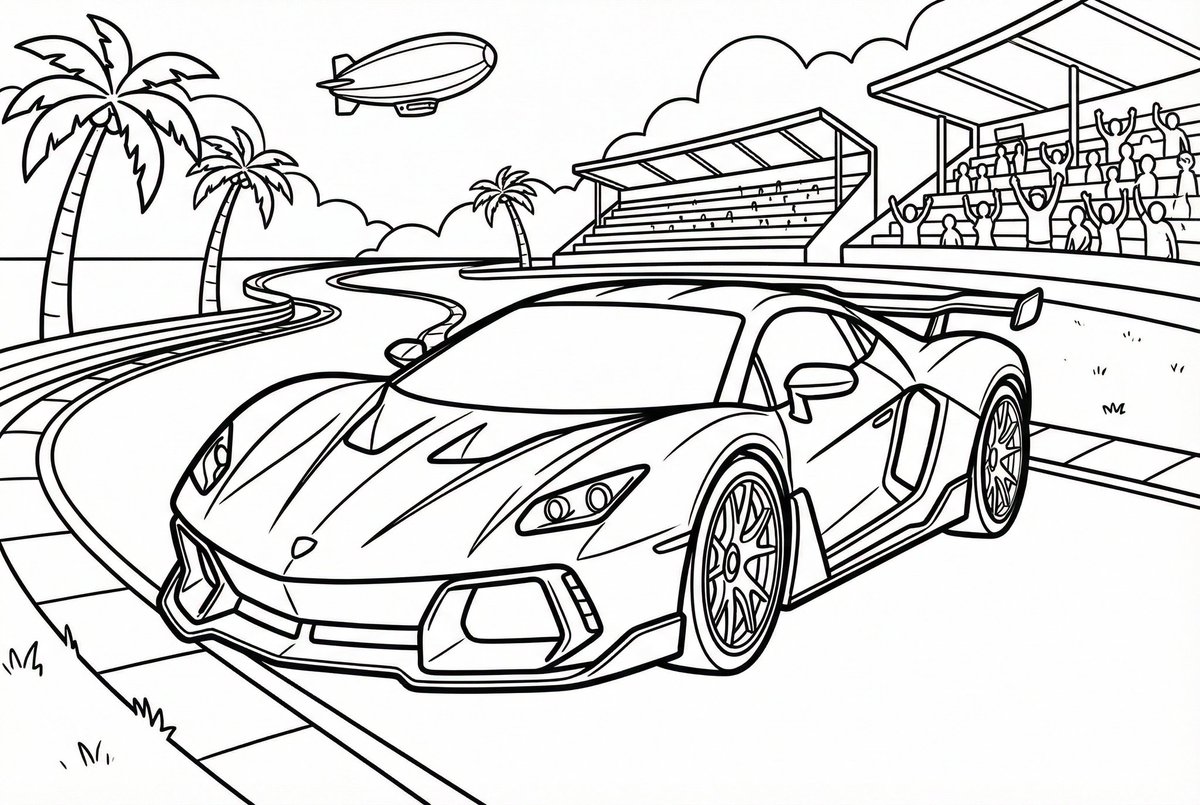
Create line art for a coloring page. The target age is {argument name="target age" default="9"} years old, and the coloring subject is {argument name="coloring subject" default="a sports car"}. Draw everything with black lines and keep the background completely white (#ffffff). Make it in a format suitable for printing, and do not draw any extra elements outside the canvas.
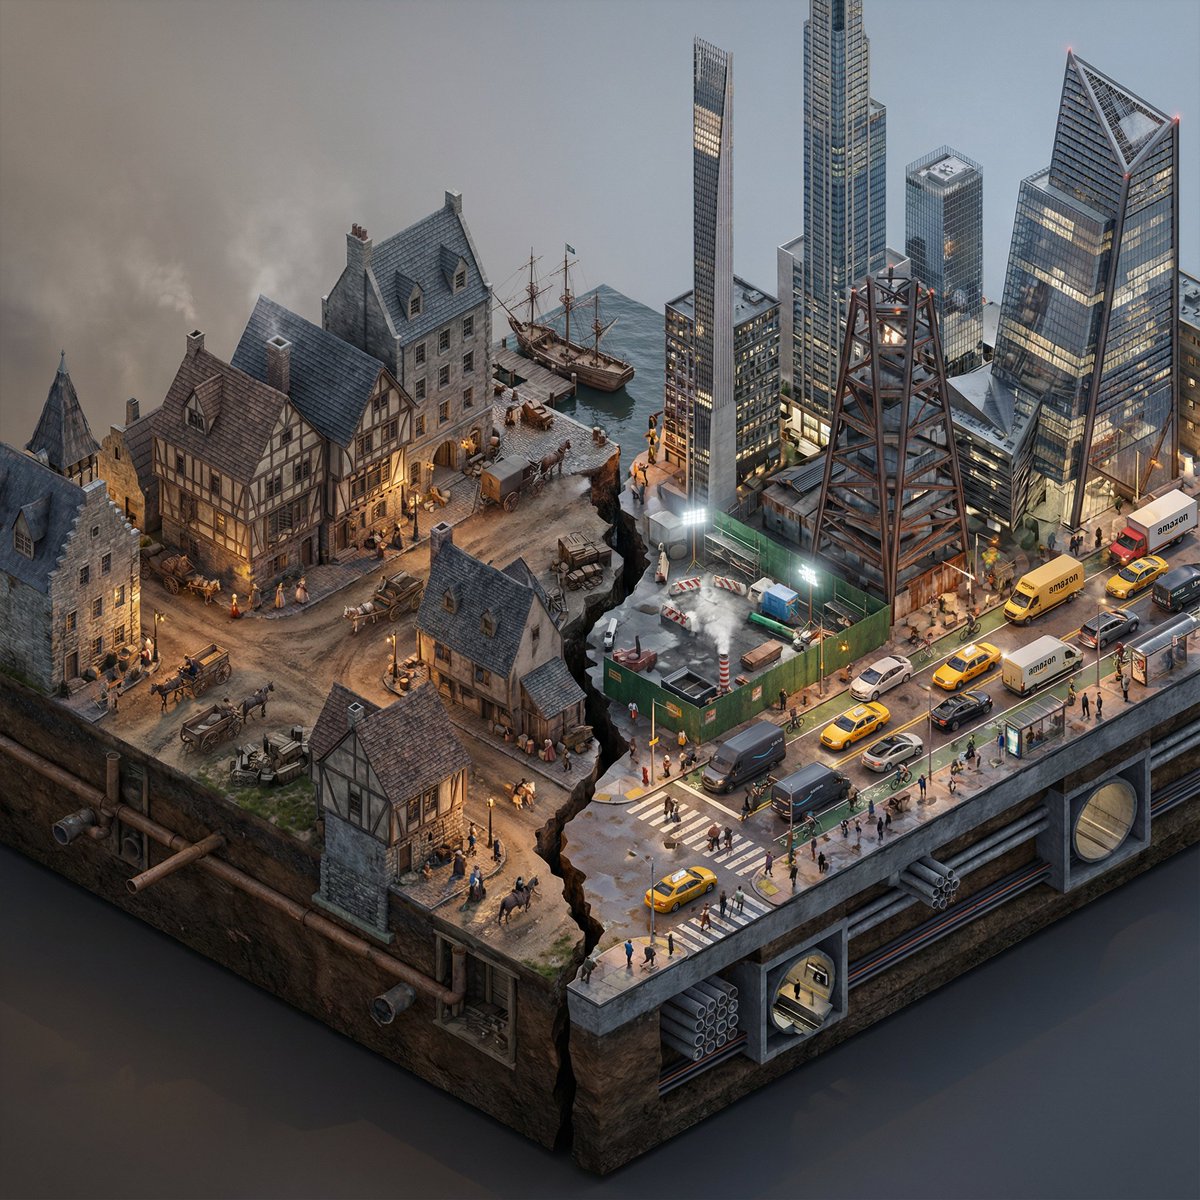
Do this for {argument name="City/Year A vs. City/Year B" default="New York 1700 vs New York 2025"} <instructions> Input Variable: [City/Year A vs. City/Year B] (e.g., New York 1900 vs. New York 2025) System Instruction: Generate a photorealistic, isometric macro render of a split-era urban diorama. The goal is Historical and Municipal Accuracy, avoiding sci-fi tropes or idealization. 1. Temporal Forensic Analysis: Analyze the Dates: Strictly adhere to the architectural technologies available in Year A versus Year B. The Left Block (The Past): Construct the Left side using the dominant vernacular of the era. For 1900: Beaux-Arts stone, brick tenements, water towers, external fire escapes, and cobblestone/early asphalt. The Right Block (The Present/Future): Construct the Right side using current urban realities, not futuristic fantasies. For 2025: Prioritize "Super-Slender" Pencil Towers (Billionaire's Row style), Glass Curtain Walls mixed with preserved older facades, and "Hudson Yards" style angled steel. Crucial Detail: If the year is modern (2020+), you MUST include Urban Clutter: Green construction plywood barriers, sidewalk scaffolding (sheds), steam vents, and delivery trucks. 2. The Container (The Cross-Section): The Base: Two suspended chunks of city infrastructure, revealing the "Underground" layer on the side profile. Left Underground: Brick sewers and early subway tunnels. Right Underground: Concrete conduit banks, fiber optic lines, and modern subway tiles. The Divider: A jagged timeline fracture. No glowing sci-fi energy. The divide is a stark cut in the asphalt. 3. The Composition (The Density): Left Street Life: Period-accurate transport (Horse-drawn carriages mixed with early Model T Fords or Trolleys). Pedestrians in dark coats/hats. Right Street Life: Municipal Realism. Yellow Taxis, Amazon delivery vans, Uber cars, and bike lanes with cyclists. The street level should feel congested and chaotic. Vegetation: Left has Elm trees (if applicable); Right has manicured "Corporate Plaza" planters and rooftop gardens. 4. Accurate Lighting Simulation (No "Neon Filters"): Left Lighting: Carbon-Arc and Gaslight. The light should be dim, patchy, and warm (2400K), casting long shadows. Right Lighting: Mixed Municipal Lighting. A chaotic mix of warm sodium streetlights (orange), harsh white LED construction lights (6000K), and internal office lighting (neutral). Do not use "Cyberpunk Blue" or "Purple" unless it is a specific billboard. Atmosphere: The Left is hazy from coal smoke. The Right has a clearer, sharper air quality but with light pollution. 5. Visual Syntax: Camera: Isometric Orthographic projection, 45-degree angle. Render Style: Photorealistic Architectural Visualization (ArchViz), 8k, V-Ray Render. Focus on texture fidelity (rust, wet pavement, grime) rather than bloom effects. Output: 1:1 Aspect Ratio, Extreme Detail, Historically Authentic.
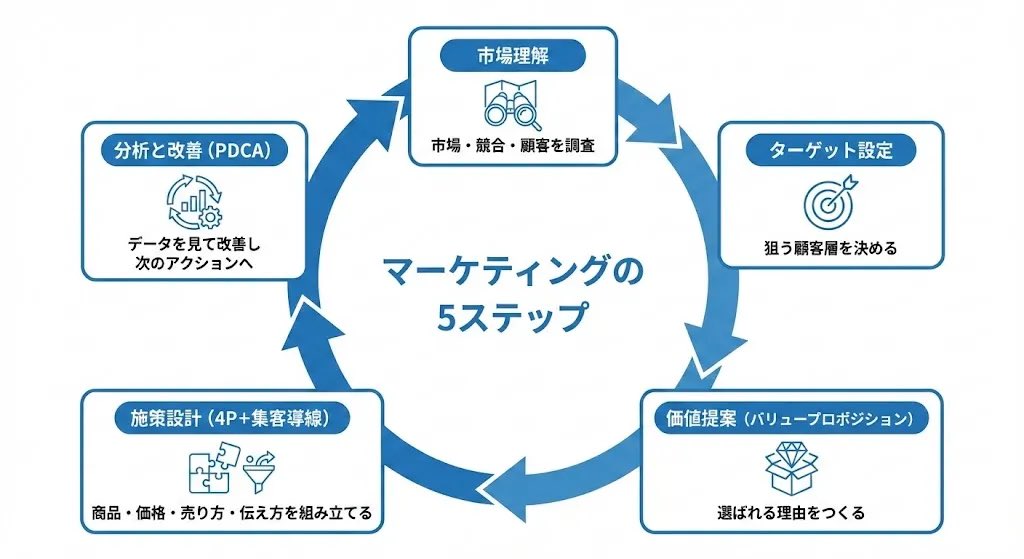
Create a diagram illustrating the "Marketing Flow" in a 5-step circular chart, represented clockwise. 【Overall Style】 ・Simple, business-oriented diagram on a white background ・Circular flowchart divided into 5 segments clockwise ・Unified with blue accent colors ・Accurately and clearly render Japanese text ・A neat design ready to be pasted directly into slide materials 【5 Steps of the Circle (Clockwise)】 Place the following 5 items on the outer circumference of the circle and connect them with thick arrows: 1. Market Understanding - Researching the market, competitors, and customers 2. Target Setting - Deciding on the target customer segment 3. Value Proposition - Creating reasons to be chosen 4. Strategy Design (4P + Customer Acquisition Funnel) - Assembling product, price, selling method, and communication 5. Analysis and Improvement (PDCA) - Reviewing data for improvement and next actions 【Layout Conditions】 ・Place "Title + Short Description" in a rounded box outside the circle ・Attach one line-art icon to each step ・Write "5 Steps of Marketing" in the center ・Arrows should clearly show the clockwise flow ・Refined composition with ample white space 【Prohibitions】 ・Do not use photos of people ・Do not include names or logos of existing companies 【Final Image】 A circular business diagram where the basic marketing process is understood at a glance through 5 elements. Quality suitable for direct use in slides or proposals.

Generate an image that explains {argument name="topic_en" default="the advantages and disadvantages of D-course graduate programs"} in an explanatory diagram.

These detailed {argument name="subject" default="infographics"} illustrate the complex sensory systems of the {argument name="target" default="human eye and human ear"}, highlighting their roles as the body's primary units for visual and auditory/vestibular processing. Both charts utilize a {argument name="layout" default="structured, clinical layout"} featuring anatomical diagrams, "Quick Profiles," and "Knowledge Scores" to break down biological functions like photoreception and sound detection. By juxtaposing the eye's delicate internal structures, such as the retina and lens, with the ear's intricate ossicles and cochlea, the images emphasize the sophisticated mechanical and neural pathways required for humans to navigate and perceive their environment.
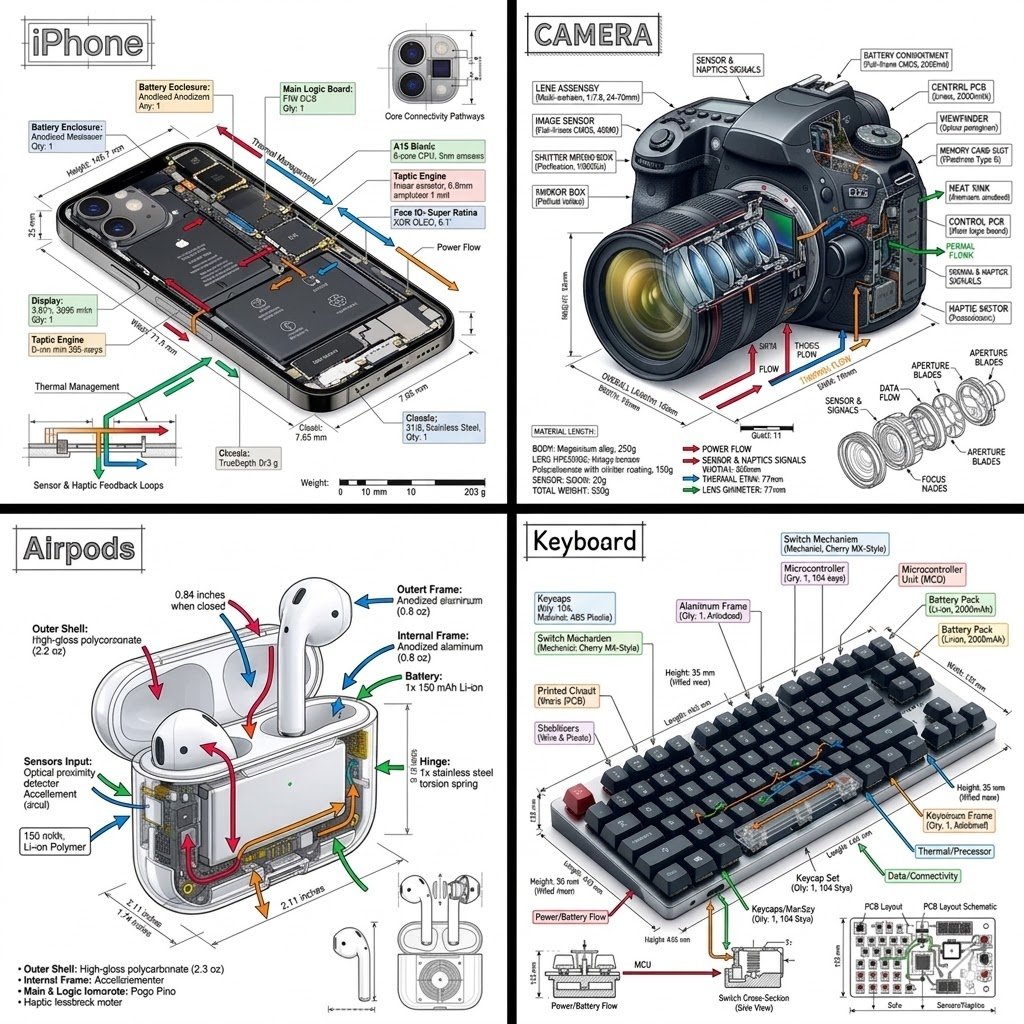
Ultra-detailed technical engineering infographic, clean {argument name="background color" default="white"} background, divided into a precise {argument name="grid layout" default="2×2 grid"} by sharp black separator lines. Blueprint-style industrial design visualization featuring photorealistic 3D renders, transparent cutaways, exploded views, dimensional annotations, technical callout boxes, measurement guides, and color-coded engineering arrows (red, blue, green, orange). Professional product design presentation, Apple-style industrial design documentation, high-end technical illustration. TOP LEFT: {argument name="primary subject" default="Modern smartphone"} shown in angled perspective with display removed, exposing densely packed internal components. Visible L-shaped battery, advanced logic board, processor chip, camera module, Face ID sensors, Taptic Engine, thermal pathways, ribbon cables, screws, connectors, and cooling architecture. Precise engineering labels and dimension lines surrounding components. TOP RIGHT: Professional mirrorless camera with large zoom lens. Longitudinal cutaway through lens assembly revealing multiple glass elements, optical groups, aperture mechanism, image sensor, shutter system, electronic components, and viewfinder structure. Additional exploded sub-diagram illustrating aperture blade construction and assembly sequence. Detailed optical engineering annotations. BOTTOM LEFT: Premium wireless earbud charging case displayed partially transparent and split open. One earbud seated inside, second earbud floating above in exploded-view configuration. Internal lithium-polymer battery, miniature logic board, charging contacts, wiring channels, magnets, and compact electronic architecture clearly visible through transparent shell. Technical callouts and component identification markers. BOTTOM RIGHT: Modern mechanical keyboard with charcoal-gray keycaps and single red accent key. Horizontal transparent cutaway sections exposing mechanical switches, switch housings, springs, stabilizers, PCB circuitry, LEDs, and internal frame structure. Lower margin includes enlarged switch cross-section diagram and geometric PCB schematic blueprint. Engineering measurements and component annotations throughout. Highly detailed CAD visualization, industrial design presentation board, precision engineering drawing, exploded assembly diagrams, transparent materials, photorealistic rendering, ultra-sharp focus, clean typography, scientific infographic aesthetics, professional product teardown documentation, white paper style, 8K resolution, museum-quality technical illustration, symmetrical layout, exceptional clarity.
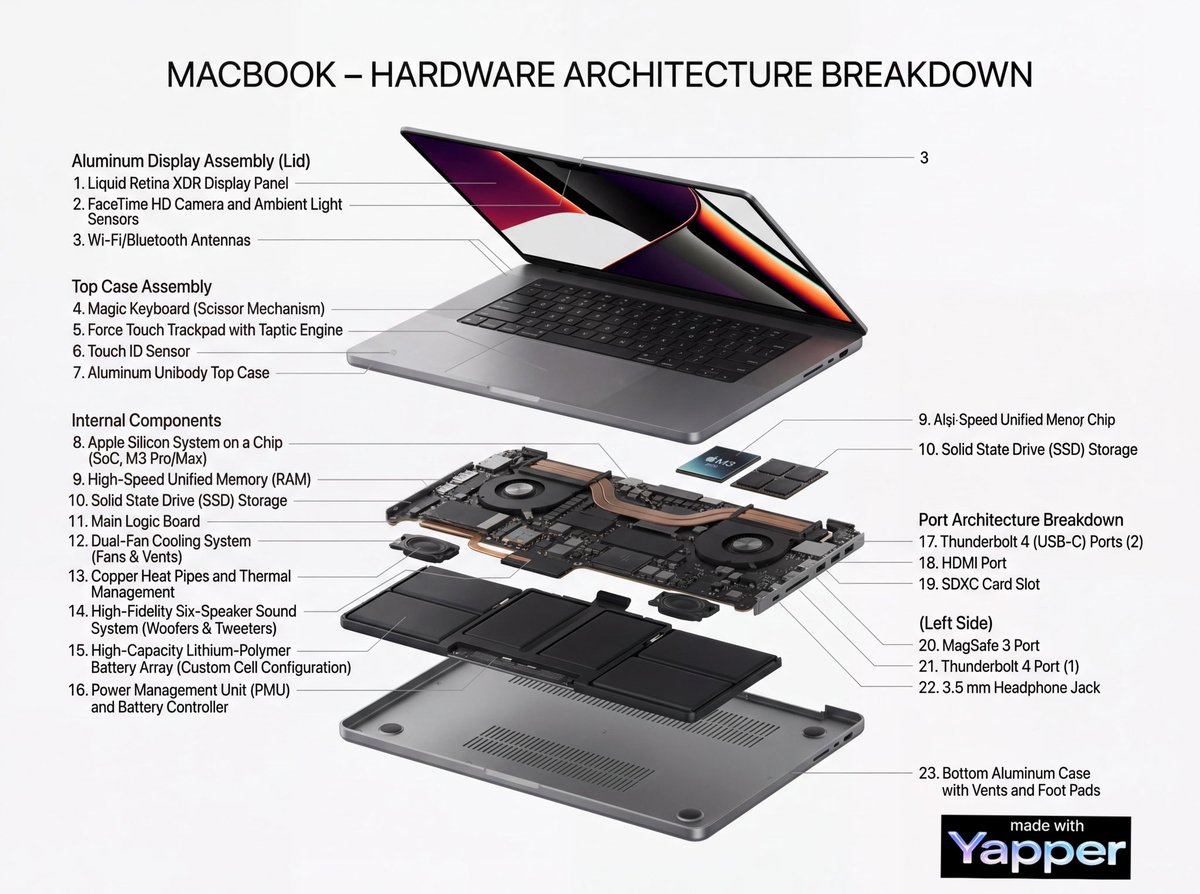
Create a high-resolution professional infographic of [{argument name="object name" default="OBJECT NAME"}]. Display the object in a clean, semi-realistic technical illustration style. Include both external structure and internal components using a cutaway view, cross-section, or exploded layout where appropriate. Automatically detect and label all major structural, mechanical, electronic, or functional components using accurate technical terminology. Use thin leader lines connecting each label precisely to the correct part. Ensure labels are clear, readable, and professionally formatted. Add a bold headline at the top: “OBJECT NAME – Complete Structural Breakdown” Layout should be balanced and organized like a modern engineering manual or product teardown poster. Background: clean white or light neutral tone. Lighting: neutral studio lighting with soft shadows for depth. Materials and textures must look realistic and detailed. Use modern sans-serif typography with clear hierarchy (bold headings, smaller technical labels). Ultra-detailed, sharp focus, 4K resolution, professional educational infographic style. No artistic distortion, no clutter, no decorative elements unrelated to structure.
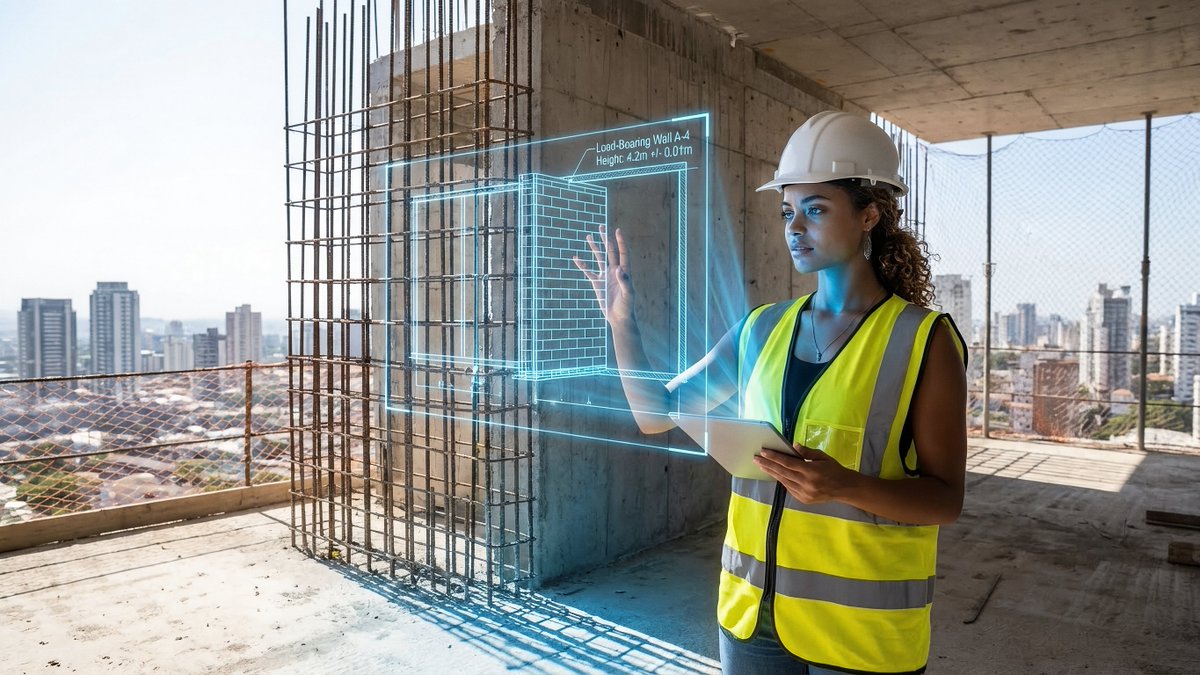
{ "promptDetails": { "description": "A construction site scene with the uploaded subject holding up an AR projection of a blueprint over the unfinished structure.", "styleTags": [ "Industrial", "Modern Architecture", "Midday Light", "Technical Schematics" ] }, "scene": { "background": { "setting": "The top floor of a new skyscraper under construction (exposed concrete and rebar)", "details": "Distant city skyline visible through open walls, safety netting, hard hats, dust motes in the air, strong texture of raw concrete floor." }, "subject": { "description": "The person defined by `[UPLOADED IMAGE]`, wearing a safety vest and hard hat, looking professional.", "pose": "Standing near the edge, holding an invisible tablet (or hand outstretched) projecting the overlay, looking critically at the structure.", "focus": "Subject and the projected blueprint are sharp; the background city is slightly softened." } }, "overlayObject": { "type": "Holographic Architectural Blueprint", "relationshipToEnvironment": "The overlay appears as a complex, translucent blue-line schematic *over* a section of the exposed rebar/wall.", "transform": "Slightly angled in 3D perspective to match the construction site's structure.", "surfaceInteraction": "Vibrant, electric blue lines with sharp white measurements, casting a subtle blue light onto the subject's vest and concrete floor.", "components": { "section": "Load-Bearing Wall A-4", "measurement": "Height: 4.2m +/- 0.01m", "position": "Projected mid-frame, aligned with the structure." } }, "technicalStyle": { "aspectRatio": "16:9", "photographyStyle": "Editorial, High Detail, Commercial", "camera": { "shotType": "Medium Shot", "angle": "Eye-level, dynamic composition emphasizing vertical lines.", "depthOfField": "Moderate, ensuring the raw background textures are visible but not distracting." }, "lighting": { "type": "Harsh, Clear Midday Sun", "description": "Strong, directional sunlight creating sharp shadows and bright highlights on metal and concrete." }, "color": { "palette": "Concrete grays, safety vest orange/yellow, and electric blue." } } }
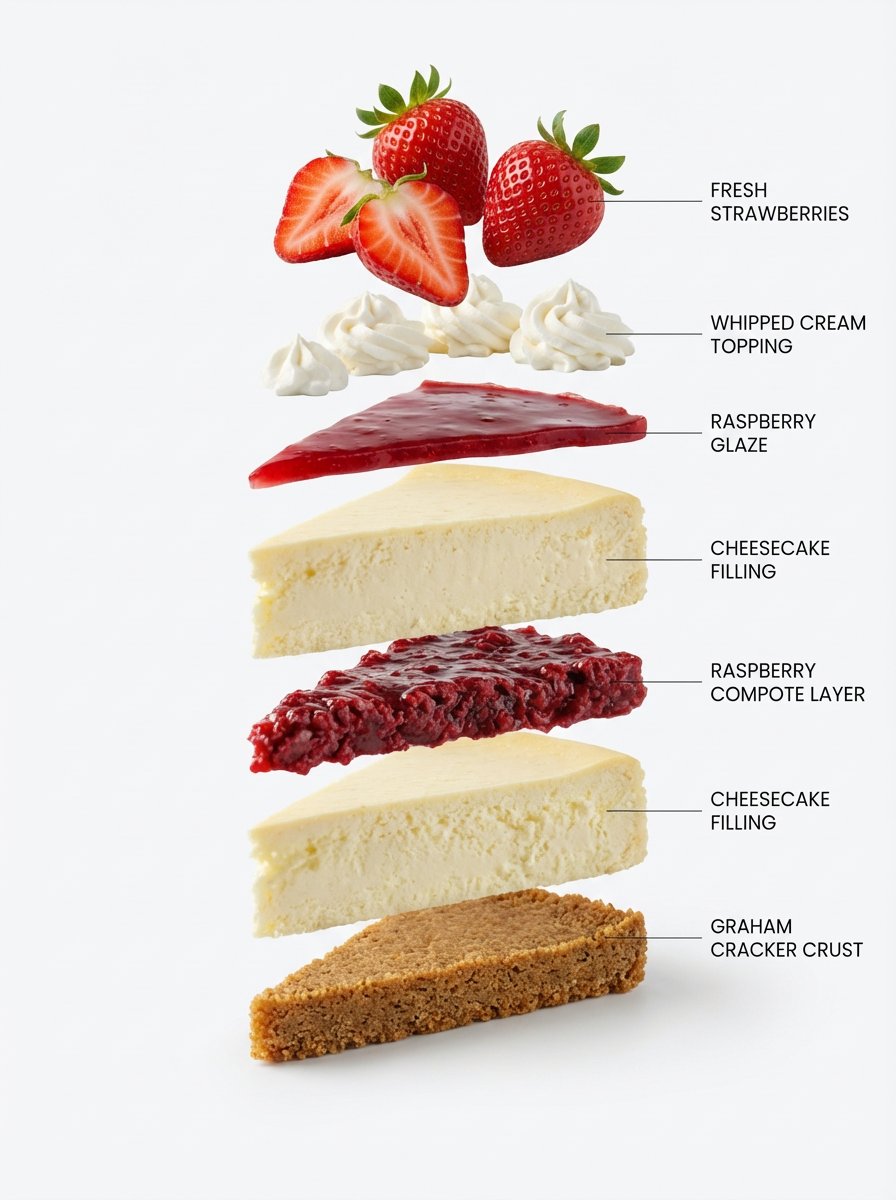
Using the first image as the base, create a clean exploded-view structural cutaway. Separate each ingredient vertically one by one, keep perfect alignment, spacing, and scale. White studio background, labeled diagram style, ultra sharp, realistic.
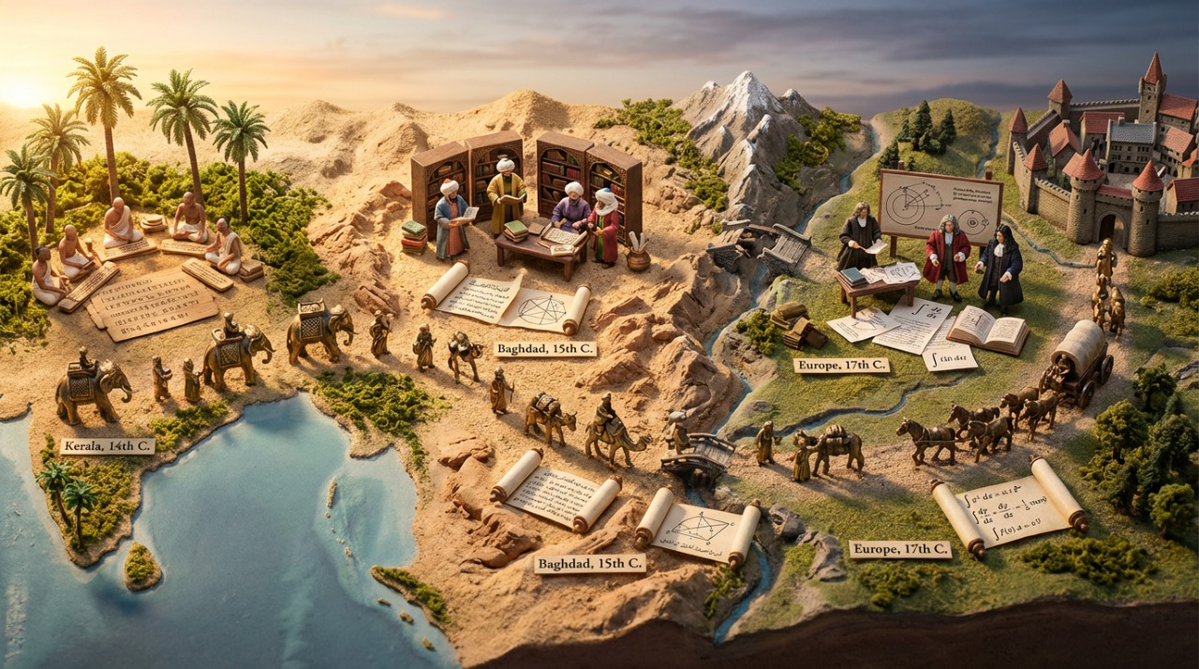
Input A: {argument name="concept" default="calculus"} Input A is a technology that traveled historical trade routes (papermaking, gunpowder, astronomy, silk production, algebra, etc.). Analyze: origin civilization, the journey route, cultural adaptations at each stop, timeline of spread. Goal: Miniature Silk Road/trade route caravan scene showing technology being transported and transformed. Rules: - Base: 3D topographic map showing actual historical route (mountains, deserts, seas) - Caravan: 8-12 miniature merchant/scholar figurines progressing along route with pack animals - Each stop: micro-diorama of how that civilization adapted the technology * Origin point: technology in pure form with inventor culture's aesthetic * Midpoint stops: hybrid versions showing cultural fusion * Destination: fully transformed/adapted version - Include: the technology itself transforming—paper becoming different textures, numbers changing symbol systems, etc. - Obstacles: miniature barriers that were overcome (mountain passes, hostile territories, language barriers shown as scroll fragments in different scripts) - Time markers: seasons/years labeled along route - Materials: actual sand/terrain materials, tiny textiles from different cultures, brass caravans - Lighting: journey from dawn (origin) to dusk (destination) across the scene Output: ONE image, 21:9 ultra-wide to capture full journey, epic historical adventure photography
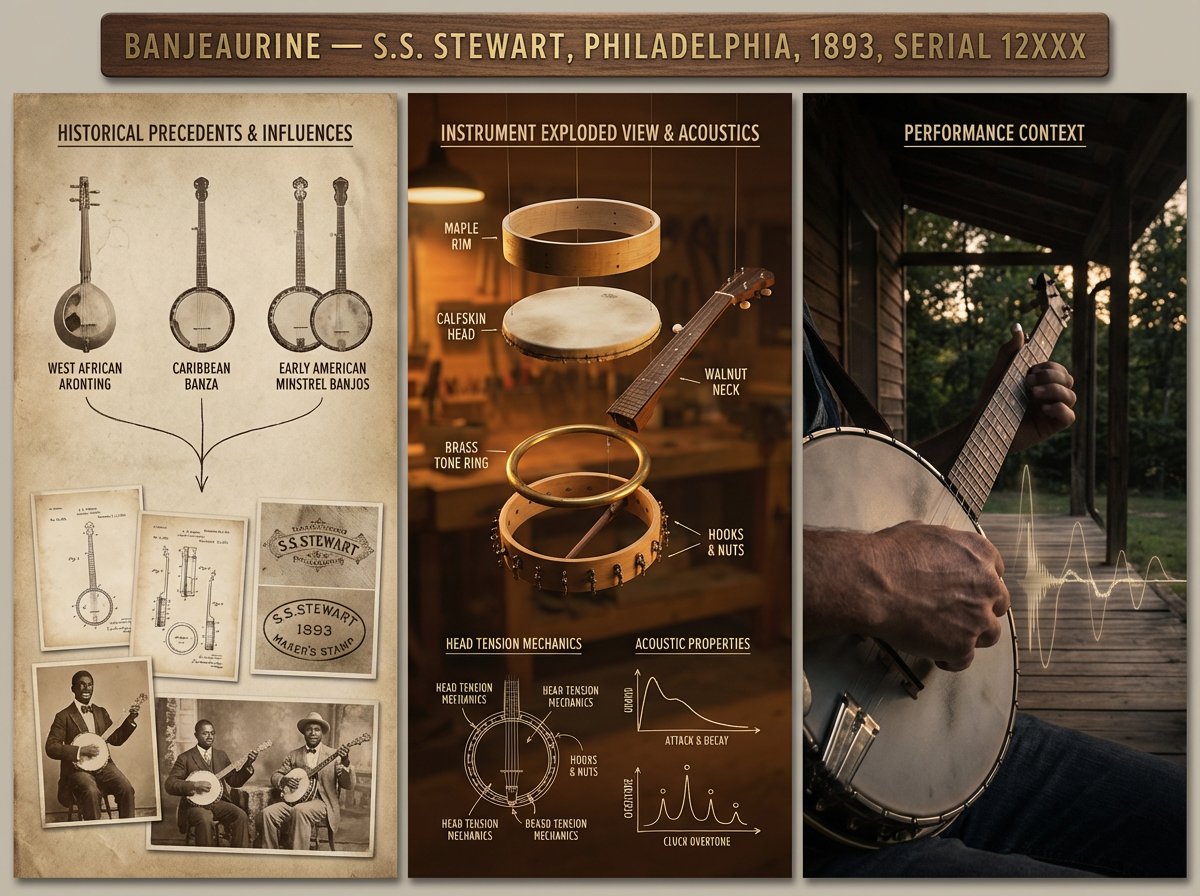
A luthier's legacy board for {argument name="instrument" default="[INSTRUMENT]"} — {argument name="maker" default="[MAKER / SCHOOL / PERIOD]"}. Left section: historical precedents and influences, showing ancestor instruments with lineage lines connecting them, maker's marks, and period photographs. Center section: the subject instrument in exploded view, every component separated and floating, wood species identified, varnish layers shown in cross-section, acoustic properties annotated with frequency response curves and tap tone locations. Right section: the instrument in performance context, musician's hands in motion, concert hall ambiance, sound made visible through subtle waveform overlay. Visual style transitions from aged daguerreotype through workshop amber to concert hall chiaroscuro. Title block reading "{argument name="instrument name" default="[INSTRUMENT NAME]"} — [MAKER], [CITY], [YEAR], OPUS [NUMBER]".
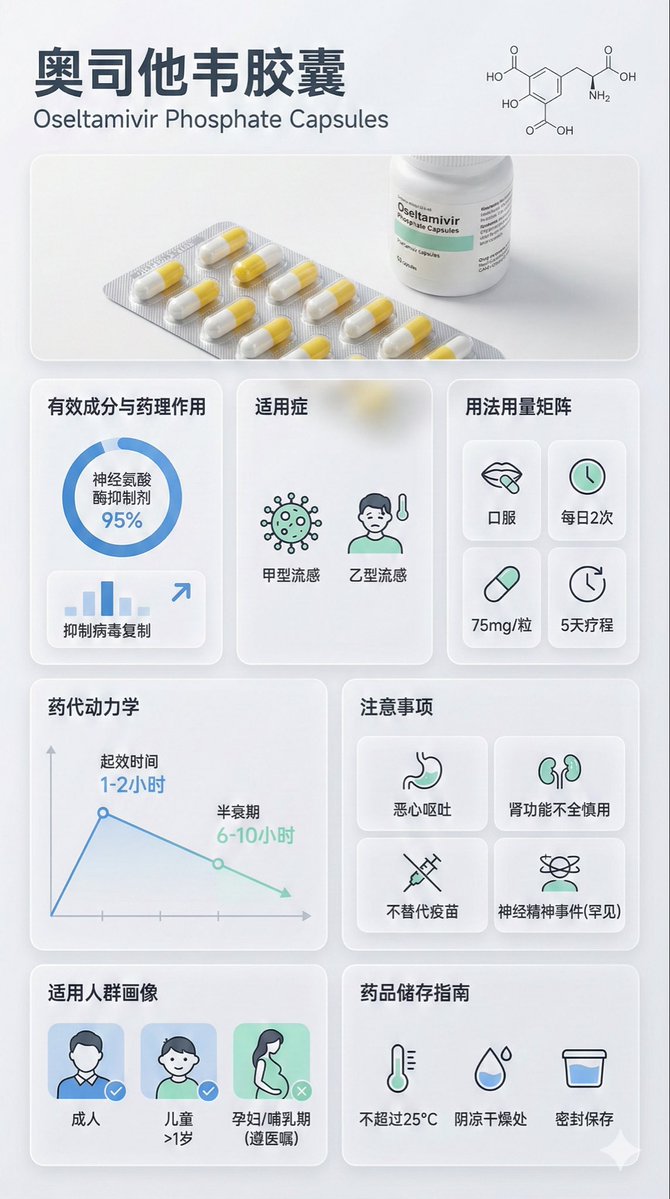
{ "image_analysis": { "subject": "{argument name="drug name" default="Oseltamivir Capsule"} Science Infographic, 9:16", "style": "Modular Bento Grid Design / Minimalist Medical UI Design", "tone": "Professional, Clinical, Rigorous, Scientific, Trustworthy", "primary_colors": ["Clinical White", "Medical Blue", "Slate Grey", "Mint Green"] }, "prompt_elements": { "subject_description": "A high-quality science infographic poster about {argument name="drug name" default="Oseltamivir Capsule"}.", "layout": "Bento box style modular grid layout, clean medical UI/UX interface design, divided into clear rectangular cards.", "visual_details": [ "Top header with striking modern sans-serif font title 'Chinese Drug Name' and its chemical/generic name", "Center top features an ultra-realistic macro photograph of the [Drug Form/Packaging] (e.g., tablet, capsule, or bottle)", "A minimalist line drawing of the [Chemical Structure] in the corner", "Section 1: Analysis of active ingredients and pharmacology with circular and bar charts, data visualization", "Section 2: Indications with minimalist line icons", "Section 3: Dosage and Administration matrix with minimalist line icons ([Oral/Injection], [Frequency], [Dose])", "Section 4: Pharmacokinetics or onset time axis with line charts", "Section 5: Precautions grid with simple warning icons ([Drug Interactions], [Contraindications], [Side Effects]), drug interactions, contraindications, side effects require online search", "Section 6: Applicable population profile icons (e.g., suitability markers for elderly, children, pregnant women)", "Section 7: Drug storage guidelines with thermometer and humidity icons" ], "art_style": "Minimalist scientific visualization design, combining detailed medical illustrations with product photography, flat medical icons, Swiss-style typography.", "lighting": "Bright laboratory shadowless lighting, clean and clear, emphasizing sterility and clarity.", "color_palette": "Monochromatic clinical white or light grey background, translucent frosted glass cards, dark grey and navy blue text, accented with medical blue or cyan to highlight key points." }, "negative_prompt": "Clutter, warm tones, vintage style, handwriting, low resolution, blur, distorted text, noise, dark background, unsanitary, oversaturated, watermark, food texture"
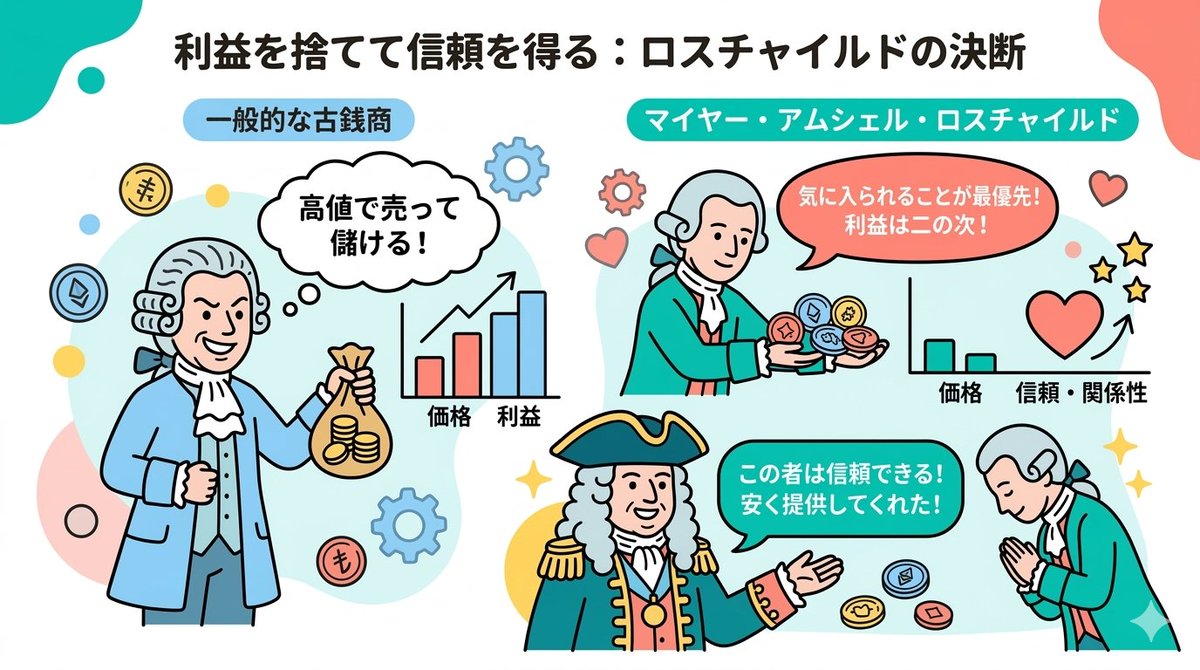
# Instructions You are a professional illustrator and prompt engineer. Read the following [Blog Summary] and create an attractive illustration that intuitively conveys its content. Display the title at the top of the illustration. # Image Size 1280px × 670px (Aspect ratio 16:9) # Output Conditions Brand Color: [#06c7b0] Simple and clean flat design. Place figures and icons drawn with uniform black outlines, partially using pastel accent colors (sky blue, coral pink, etc.). Emphasize rounded shapes and a soft impression. Diagram-centric composition (e.g., Venn diagrams, bar graphs, speech bubbles) with a friendly tone suitable for materials viewed by students and young people, or for social media. Design with ample white space, prioritizing visibility and balance. The figures appearing should be dressed as 18th-century European nobility. # Blog Summary Mayer Amschel Rothschild was not born into a privileged class, but a turning point arrived. He gained the opportunity to provide antique coins to Wilhelm IX, the Elector of Hesse, the regional ruler. However, that alone would make him just another antique coin dealer. What made him unusual was that he continued to provide rare antique coins to Wilhelm IX "at prices significantly lower than the market rate, disregarding profit." Normally, one would try to overcharge a person in power. But he prioritized gaining favor over picking up immediate small change.
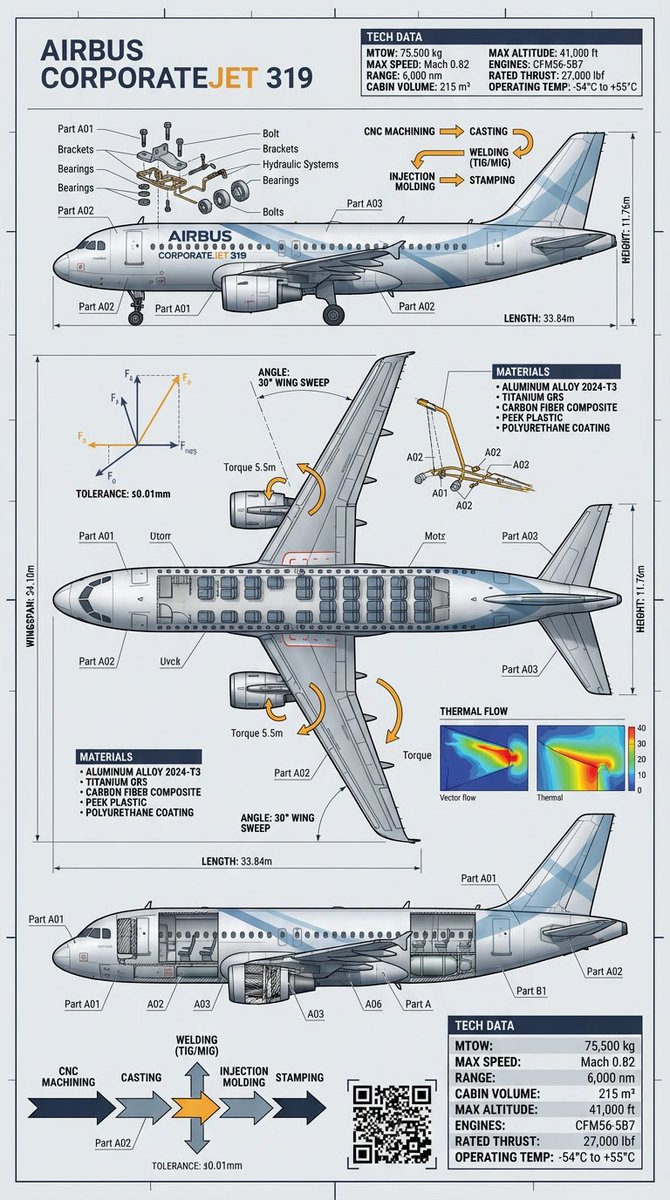
From raw object to factory-grade blueprint Precision visualized with Gemini Nano Banana Pro on @lovart_ai

Turn the advantages of investing in Vietnam into a single slide.
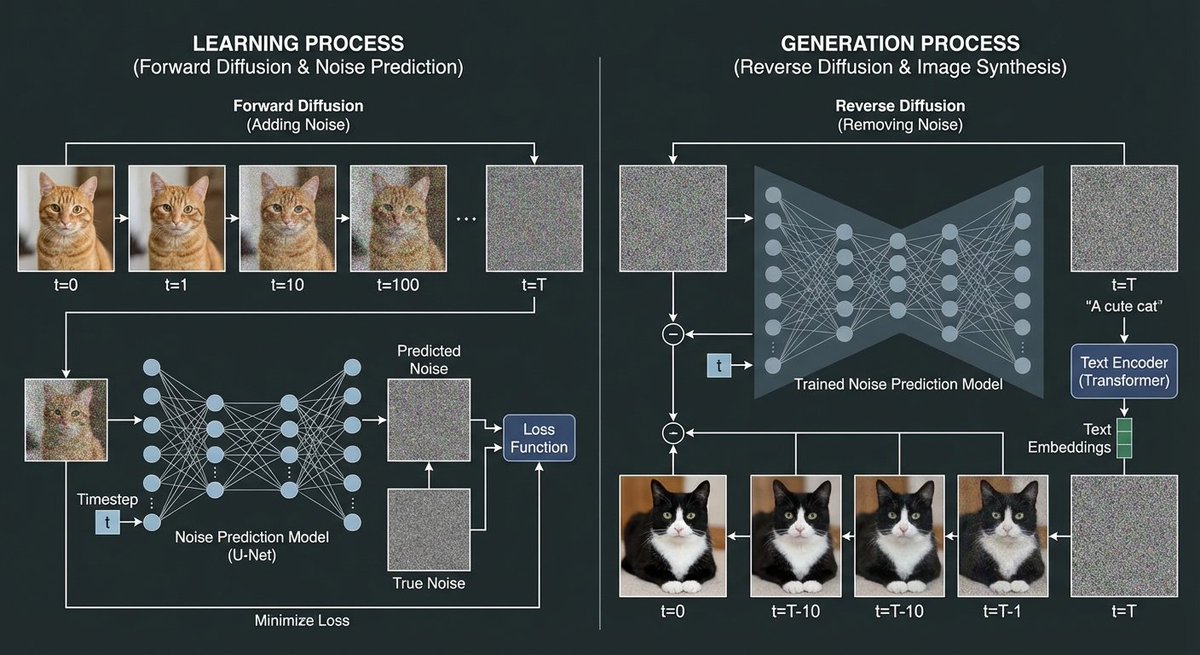
Using a cat image and noise images, create a diagram explaining the image generation process of a diffusion model. In the training process, show the process of adding noise to the cat image through forward diffusion, and depict the process of creating the noise prediction model.

Secret prompt revealed for instantly generating "viral diagrams" with Gemini "Nano Banana Pro" ・ Diagram creation Bot ・ Four-panel comic creation
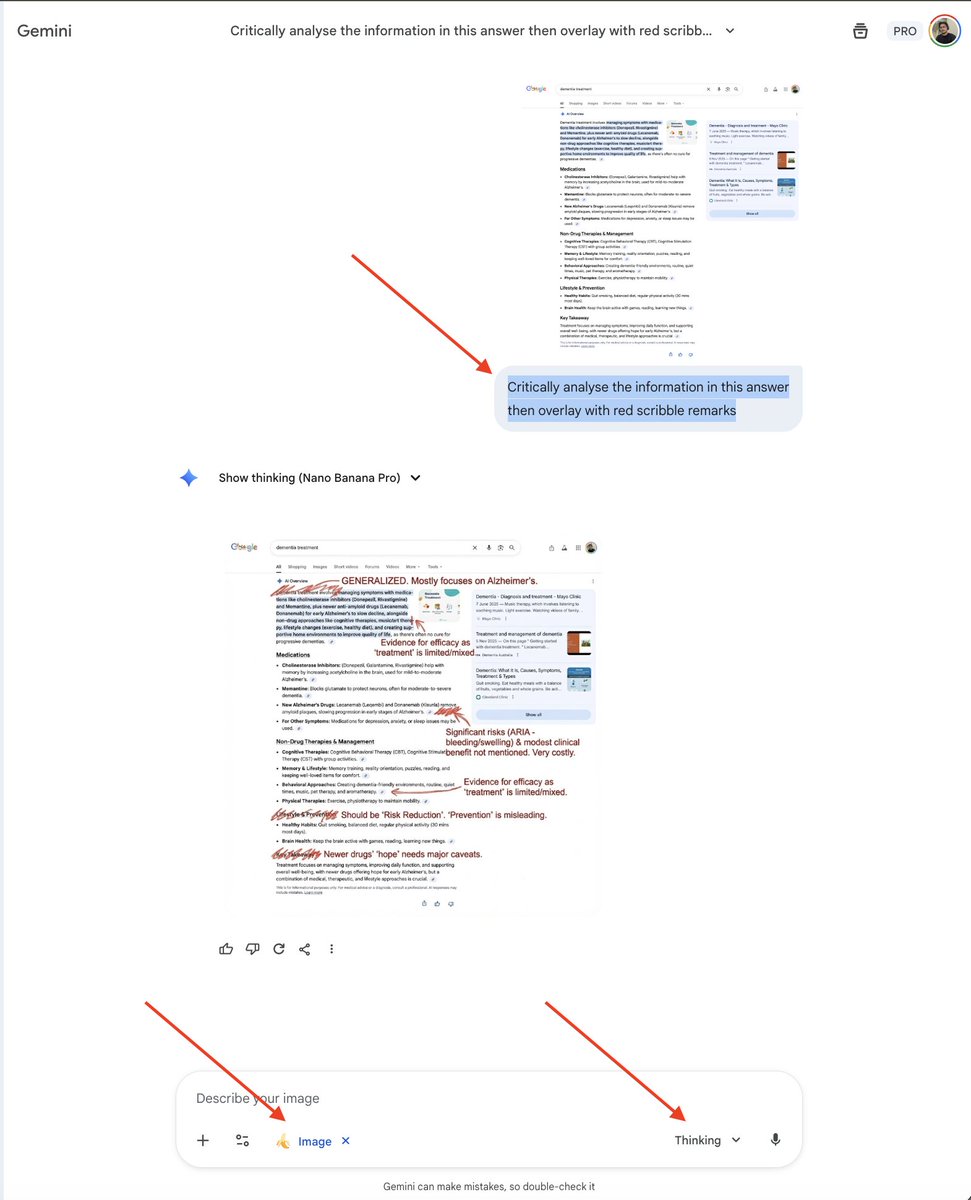
Critically analyse the information in this answer then overlay with red scribble remarks
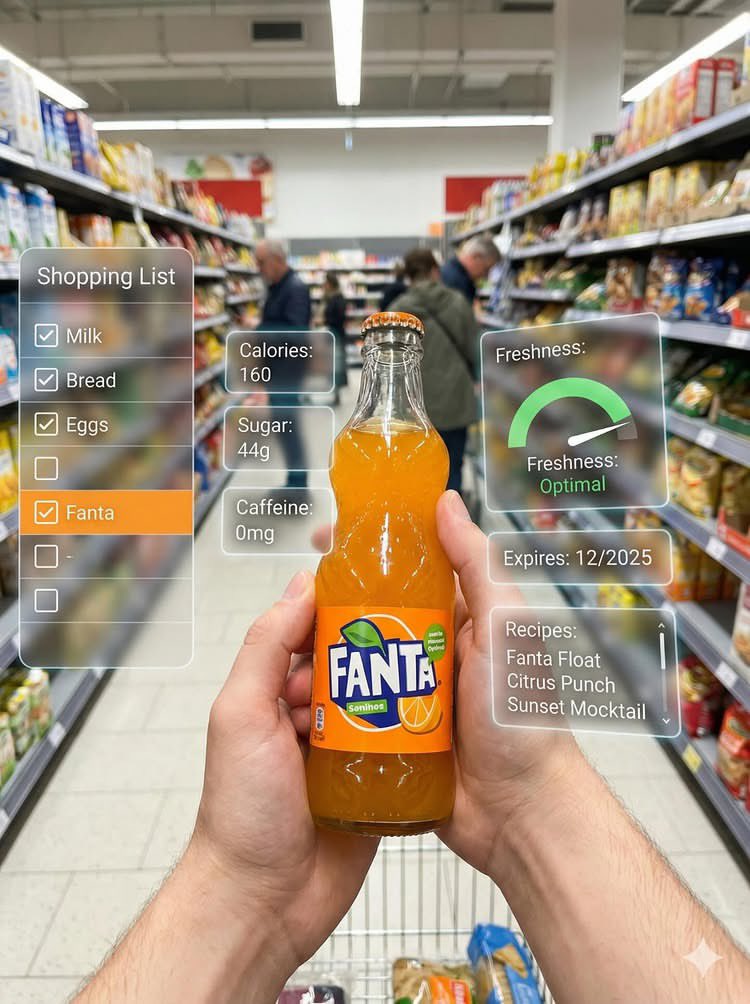
First-person perspective inside a brightly lit supermarket aisle or section. Realistic human hands are holding {argument name="product name" default="[PRODUCT NAME]"} close to the camera. The product’s [key visual traits: color, texture, packaging, freshness details] are clearly visible under natural store lighting. The {argument name="product name 2" default="[PRODUCT NAME]"} is surrounded by a multi-layered holographic augmented reality interface displaying relevant product information, including [nutritional or product data such as calories, protein/sugar/caffeine, vitamins, freshness indicator, origin, expiration date, usage or recipe suggestions]. The AR UI elements smoothly shift and reorganize based on the viewer’s gaze direction, as if dynamically responding to user focus. In the left peripheral vision, a vertical semi-transparent shopping list is visible with checked-off items, where {argument name="product name 3" default="[PRODUCT NAME]"} is highlighted as the currently active selection. Hyper-realistic mixed reality, clean futuristic AR design, glass-like UI panels, soft ambient glow, realistic lighting and shadows, natural depth of field, immersive first-person interface, showcasing next-generation retail technology.
部分提示词收录自 X 平台创作者,版权归原作者所有。